Data Scientist in Python Journey
Follow my journey!
2022-01-27
It's been a while since I've updated this blog but I haven't been slacking on my coding grind. I decided that everyday I will code for 1hr. That could be taking a course on Datacamp, working on a project or updating my website (using HTML). I'm looking to expand my HTML game by downloading another template from HTML5UP and copying parts of the code onto here.
Anways, I started a course called Data Manipulation with pandas where I learned how to transform, aggregate, slice, index, create and visualize dataframes I also learnt how to deal with missing values using df.isna().any(). There are a few ways to deal with missing values but right now it is outside the scale of the course - we just learnt how to remove rows with missing values using df.dropna(). Alternatively, you can use df.fillna(0) to fill missing values with 0 which can be a issue if there are far too many 0's in your dataset.
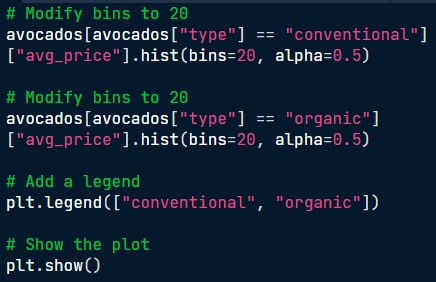
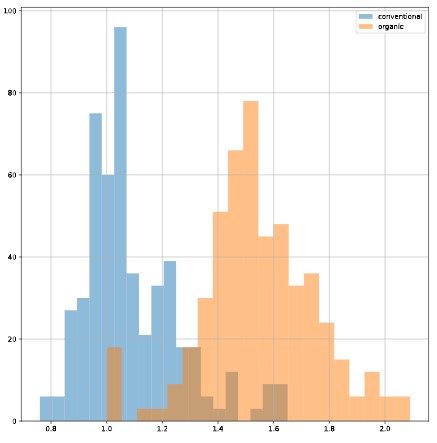
The code above creates a histogram of avocado prices based on the type (conventional vs organic). Avocados[avocados["type"]] tells python to select the column type and we set this equal to "conventional". With this, we are telling Python to select only conventional avocados. ["avg_price"].hist(bins=20, alpha=0.5) allows us to to create a histogram of average prices based on the type of avocado (conventional). Bins=20 specifies to have 20 bins and alpha = 0.5 makes the colour more transparent. The result graph is below.
2022-01-18
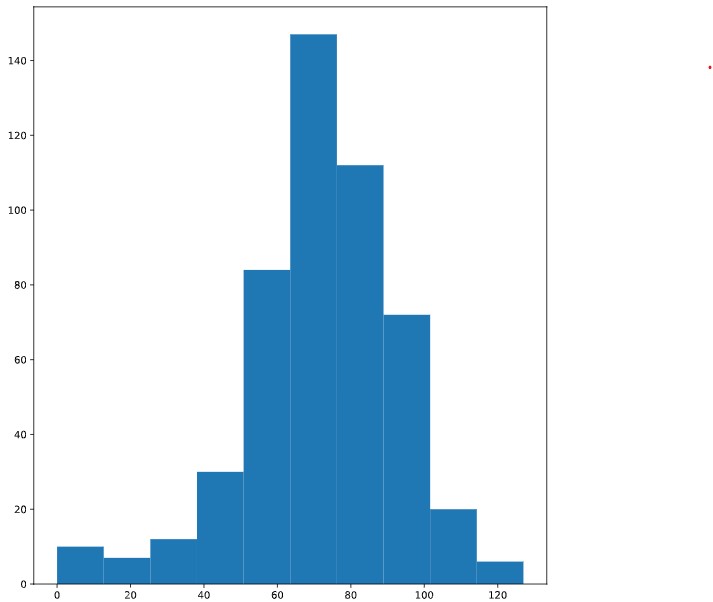
So I finally finished the course, and the project at the end wasn't as challenging as I'd imagined it to be. The problem starts with you playing a game with your friend, and you're tasked to walk up to the 60th floor. However, you have to roll a dice one hundred times to go up. If it lands on a 1 or 2, you'll go one step down. If it's 3, 4 or 5, you'll go one step up. If you throw a 6, you'll throw the die again and walk up the resulting number of steps. Also, there is a 0.1% chance that you can slip and fall to the first floor. What is the chance that you will win this bet? To solve this, we have to simulate this process thousands of times and see what fraction of the simulations you will reach 60 steps.
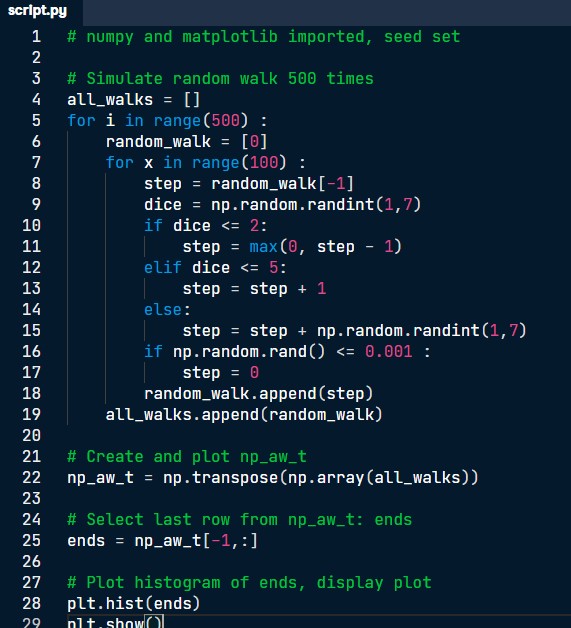
The 5th line of code tells Python to run the experiment 500 times. "Random_walk = [0]" means we start at the bottom of the empire state building, and the following code tells Python for each experiment, you are going to roll the dice 100 times. In the 9th line, we specify that the dice can take up a random number between 1 and 6, and the following several lines set up the conditions. The 16th line factors in the 0.01% chance you might slip and fall. Finally, we transpose the NumPy array, create a new array consisting of the last row (how high you climbed), and plot its histogram.
2022-01-14: Intermediate Python Course
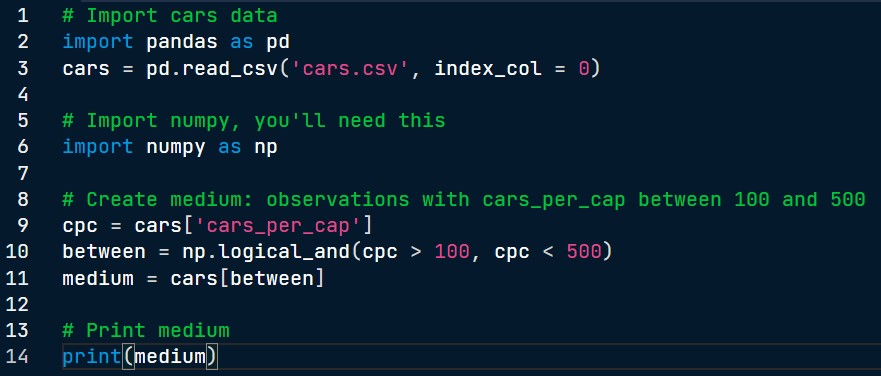
It's been a few days since I last updated this blog, but I've learnt a few new things. In today's lesson, I learnt about pandas and how to import it using "import pandas as pd". I learnt how to create a dataframe from a dictionary which is a time-consuming process if you are working with large amounts of data. Typically, you would import a csv using, "pd.read_csv("insert.csv", index_col = 0). We were also introduced to if, elife, else commands and filtering dataframes. The code below is an example of filtering dataframes. From cars, the 9th line specifies that python should select the "cars_per_cap" column. The following code np.logical_and is a boolean operator which tells python to cpc values greater than 100 and less than 500. Lastly the variable, medium, shows us a dataframe of all observations with cars_per_cap between 100 and 500. I hope to finish this course by tomorrow! The last chapter of this course is a a project! See you soon.
2022-01-11: Intermediate Python Course
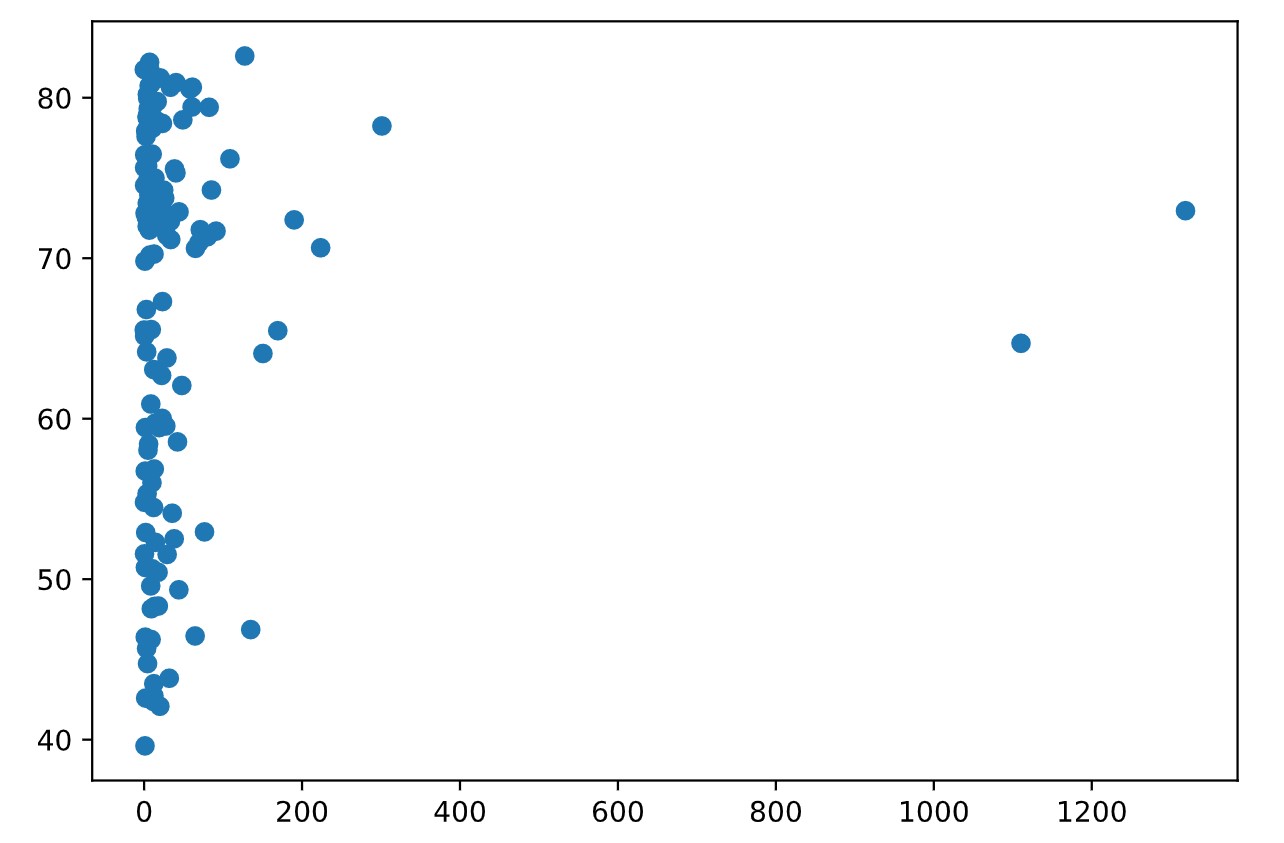
Today I started the Intermediate Python course on Datacamp. The stuff today was very basic, it covered creating graphs such as scatter plots, histograms and line graphs. Here is a graph that I created using plt.scatter(pop, life_exp) - super simple, it's just a scatter plot of population plotted against age which illustrates that there is no clear relationship between the two variables. On a side note, I'm also learning a bit of HTML to code this website (I had to look up the code to center the image below!).